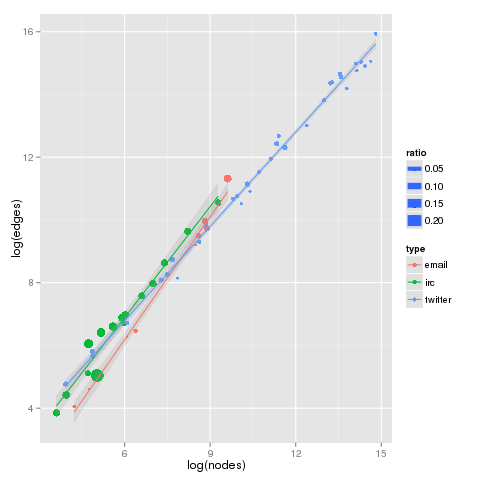
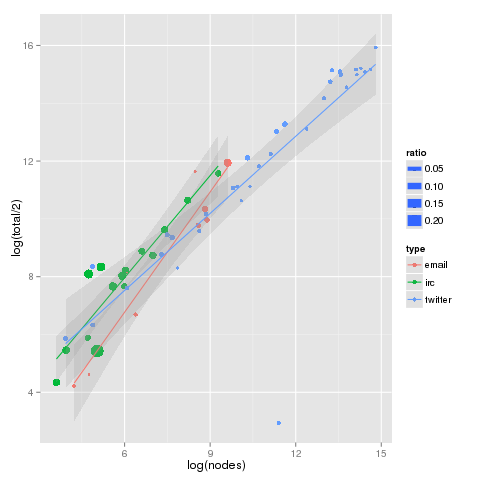
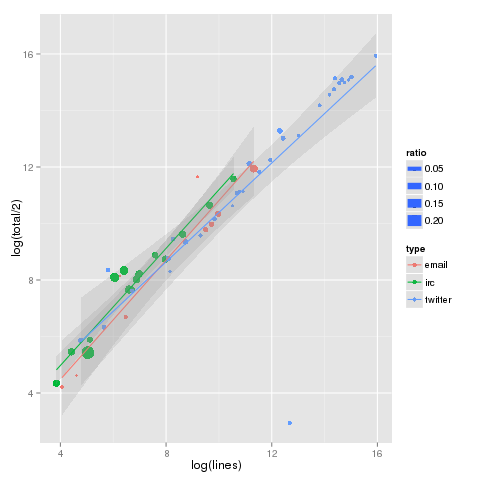
In a surprise to Marshall McLuhan, we see ad hoc conversations conducted through different electronic media demonstrating very similar scaling characteristics across number of nodes, number of edges, and number of unique edges. Looking at email lists, IRC, and long-term twitter searches, we more similarity than difference between the three media.
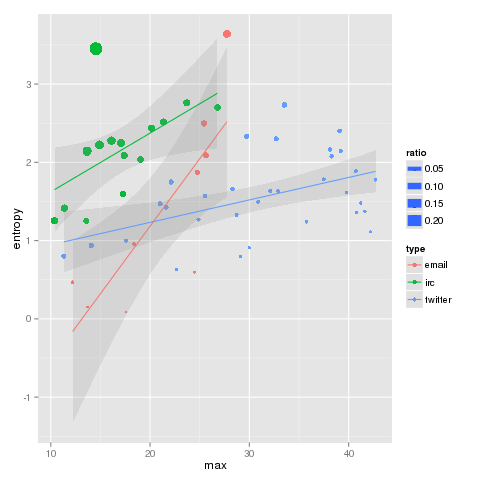
However, when look at the observed conditional entropy (below the fold), the differences become clear: communication patterns are very different by media type, even as the networks scale similarly in communicants. Maybe McLuhan was right.
Wikipedia defines conditional entropy as: the amount of information needed to describe the outcome of a random variable Y given that the value of another random variable X is known. For our networks, X is the source node, and Y the recipient. We sum these across all source nodes, and we have the conditional entropy on the observed network. This number is strongly affected by “balance” of communication, and reaches is maximum value when all nodes communicate with all other nodes the same amount.
Comparing the observed conditional entropy with maximum theoretical entropy for the same network, we see the first strong divergence in characteristics. The size of the points in the below graphs (as well as the above) are the ratio of observed to maximum conditional entropy, or relative conditional entropy. The larger the ratio, the greater balance in communication between all participants. Playing loosely with terms, very democratic networks have large ratios, and despotic small.
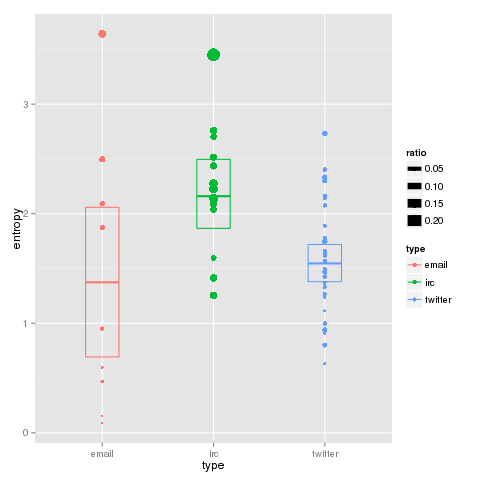
Below, we can see the observed conditional entropy for each sample by type. The box indicates the 95% confidence interval for the type in question. We see a strong distinction between IRC and twitter, with email showing much more loose clustering.
Comments on methodology
Nodes are individuals whom have communicated to another node, and/or have been on the receiving end of a communication. Membership to email lists and attendance in an IRC channel are not included, nor are broadcast messages without individual designated recipients.
All edges are directed for the calculation of observed entropy.
Both email and IRC sources are technical in content. Future study recommends observations across a wide-set of content types.
Twitter search topics include a wide range including technical, commercial brand, and political terms.
R code to generate the above graphs
 library(ggplot2)

csv2<-read.csv("conditionalentropies.csv",header=T)

csv2$edges <- csv$lines # for clarity in graph legends

attach(csv2)

png("conditionalslog.png")

qplot(log(nodes), log(edges), data=csv2,colour=type, cex=ratio) + geom_smooth(method = 'lm', alpha = 0.2) dev.off()

png("nodesVtotal.png")

qplot(log(nodes), log(total/2), data=csv2,colour=type, cex=ratio) + geom_smooth(method = 'lm', alpha = 0.2)

dev.off()

png("edgesVtotal.png")

qplot(log(lines), log(total/2), data=csv2,colour=type, cex=ratio) + geom_smooth(method = 'lm', alpha = 0.2)

dev.off()

png("entropy.png")

qplot(max, entropy, data=csv2,colour=type, cex=ratio) + geom_smooth(method = 'lm', alpha = 0.2)

dev.off()

library(Hmisc)

png("entropyvar.png")

smry <- stat_summary(fun.data="mean_cl_boot", conf.int=0.95, geom="crossbar", width=0.3)

qplot(type, entropy,col=type) + smry

dev.off()
Notes on the code
“lines” and “edges” are used interchangeably, these are the same value.
“total/2” is the total number of observed edges, not corrected for uniqueness. E.g. edges seen in the following pattern: A-B A-B C-D, would have a total/2 of 3. The “/2” is in place to correct an artifact of the way the data was collected.
Graph formatting ideas from a presentation by Hadley Wickham.
Leave a Reply
You must be logged in to post a comment.