When will network analysis provide additional insight into game theory? In a word: inequality.
There must be some form of quantifiable inequality in the game: access, strength of relationships, goals, etc. This difference creates opportunities for the individual players to use information (or resource) asymmetries and broker to their benefit.
On the left all of the arrows representing the relationships have the same weight, representing the same value, in both directions and between all nodes. On the right, the arrows have different weights between nodes. The greater the inequality, the more effective the application of network analysis.
The relationships depicted could be import/export pairs ($ or volume), contract frequency, or even strength of social relationships. Do not underestimate the potential utility in measuring based on qualitative values, such as strength of relationships. Using them can not only be quite effective, but they can often be much easier to calculate than one might suspect at the onset. Here’s why.
The analysis method I suggest looks at all of the weights relative to the originating node. It does not matter whether you can accurately value A’s relationship to B versus B’s relationship to A, as long as you can compare A’s relationship to B versus A’s relationship to C. From the point of data collection, even an intuitive estimation these comparative values will provide insight. Thus knowing A wants something from B more than A wants the alternative from C, is often sufficient.
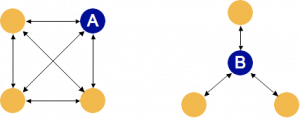
Looking at the perspective of access, this is represented in the shape of the network as “holes” or gaps. There are technical definitions, but it’s usually quicker to understand through an image. Compare:
 From the perspective of the two darker nodes A and B, they clearly have different opportunities to act as brokers based on the holes (or lack thereof) in the network.
Using the two of these together has shown some promising results.
Here is a simplified version of one of the tools I wrote to calculate the opportunity to act as broker based on the value of relationships and the network. The TAR file contains the simplified program written in Perl, and two sample CSV network files: one similar to each network in the second image. The program relies on a module not yet indexed by CPAN, but is available there.
The calculation is called the network constraint, after Ronald Burt’s work. The lower the constraint, the larger the opportunity to act as a broker, i.e. perform well in the game based on network structure.
I am in the process of requesting CPAN to host the Perl module, in registered space, so stay tuned.
[for an older version of the code, with some egregious bugs, but all in one place and no extra downloading, get it here]
