Network Analysis Application to Game Theory (with Software)

When will network analysis provide additional insight into game theory? In a word: inequality.

There must be some form of quantifiable inequality in the game: access, strength of relationships, goals, etc.  This difference creates opportunities for the individual players to use information (or resource) asymmetries and broker to their benefit.

unequalrelationships1

On the left all of the arrows representing the relationships have the same weight, representing the same value, in both directions and between all nodes.  On the right, the arrows have different weights between nodes. The greater the inequality, the more effective the application of network analysis.

The relationships depicted could be import/export pairs ($ or volume), contract frequency, or even strength of social relationships. Do not underestimate the potential utility in measuring based on qualitative values, such as strength of relationships. Using them can not only be quite effective, but they can often be much easier to calculate than one might suspect at the onset.  Here’s why.

The analysis method I suggest looks at all of the weights relative to the originating node.  It does not matter whether you can accurately value A’s relationship to B versus B’s relationship to A, as long as you can compare A’s relationship to B versus A’s relationship to C.  From the point of data collection, even an intuitive estimation these comparative values will provide insight. Thus knowing A wants something from B more than A wants the alternative from C, is often sufficient.

Looking at the perspective of access, this is represented in the shape of the network as “holes” or gaps.  There are technical definitions, but it’s usually quicker to understand through an image. Compare:
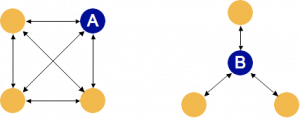
locationlocationlocationFrom the perspective of the two darker nodes A and B, they clearly have different opportunities to act as brokers based on the holes (or lack thereof) in the network.

Using the two of these together has shown some promising results.

Here is a simplified version of one of the tools I wrote to calculate the opportunity to act as broker based on the value of relationships and the network.  The TAR file contains the simplified program written in Perl, and two sample CSV network files: one similar to each network in the second image. The program relies on a module not yet indexed by CPAN, but is available there.

The calculation is called the network constraint, after Ronald Burt’s work.  The lower the constraint, the larger the opportunity to act as a broker, i.e. perform well in the game based on network structure.

I am in the process of requesting CPAN to host the Perl module, in registered space, so stay tuned.

[for an older version of the code, with some egregious bugs, but all in one place and no extra downloading, get it here]

Sales Teams need Social Networks

Effective use of social networks (SN’s) is closer to sales than it is to marketing.  You want to build momentum in the network, and marketing alone will not provide that.

There’s a lot more to SN’s than better demographics, and given the abysmal value advertisers are are placing on Facebook (suggested $0.32 CPM vs. $1.15 for average online CPM in 2007 as per CPM Advisors LLC), demographics just aren’t cutting it.

Sealing the Deal
Sealing the Deal

The alternative SN’s should looking to is helping companies sell to their networks.  With all of the embedded relationship information, any salesman would love to get their hands on that data for companies they are selling to.

As SN’s age and continue to fill in, this becomes a reasonable opportunity (LinkedIn is already there).  In the meantime, SN’s have to provie value to retails scale vendors.  Since the per-sale return from using a sales team is likely to be negative, they need to place their bets on individuals likely to get others to buy too.

In other industries, we’ll use pharmaceuticals as our example, market research teams will do extensive survey work to determine the most influential figures in decision making relevant to their products.

Even after the enormous expense of conducting these 6 month or more research projects, and taking into account all of the known problems with determining influence with surveys, pharmaceutical companies often dedicate a specialized sales team to act on the data.  One company analyzed in a current paper showed approximately a 20% increase in revenue from this collaboration between marketing and sales.

Unfortunately, survey based methodologies become prohibitively expensive when moving from a 1,000 to 10,000 doctor network to a 10 or 100 million customer retail market.

The good news is, SN data is better and more accurate than surveys, and the data already exists.  You have the actual relationship matrix, rather than skewed survey information.  That alone provides quite a punch to sales.  Marry that with frequency of communication data, and you’ve got a goldmine for sales.

[Photo by: Beth and Christian]

Great Work, Lousy Title

13th Century Social Network of Deeds in France

Good news, from Roland Piquepaille over at ZDNet…

According to Nature News, a team of French researchers has used medieval documents to create the oldest detailed social network ever constructed. The mathematicians and computer scientists looked through thousands of records of land transactions dating back as far as 1260 in a Southwest part of France.

Makes me wonder why I did not come across it earlier. Oh, right, because they titled the paper Batch kernel SOM and related Laplacian methods for social network analysis. Shame on you French Scientists, don’t hide the good stuff.

Playing with Circos

Martin Krzywinski at the Genome Sciences Centre of the BC Cancer Agency, created software called Circos designed to help elucidate the interaction of genes, and has used it to create some truly beautiful graphs.

The software is pretty complex, and I have only figured out how to use his simple on-line version, which limits the number of inputs.  But, even so, here is an image I created using Circos.  The image represents the number of emails exchanged by the top 10 most connected participants with each other, from an active large email list.

Relative % of each other's time

Lower Limits on Social Network Analysis: Just Ask

Are there lower limits to the size of Social Networks worth analyzing?  The upper limit seems to be a function of how much time (and compute power) you have, but the lower?

When we do analyses, these are certain characteristics we look for as verification that our models hold.  A key characteristic is the shape of the distribution of the number of relationships.

Expected
Observed
Senate Observed

Power-law relationships in social networks are so pervasive, we are surprised when we do not see them.  The co-sponsorship of Senate Resolutions, is one such example where we do not see a power-law distribution.  In the current session, the 110th, the distribution is just about as different as you can get from a power-law: the result is linear (R-sq > 0.97).  My hypothesis is the number of Senators is just too few for the power-law distribution to emerge.

Since there are some significant constitutional barriers to increasing the number of Senators and taking a new sample, in order to test this hypothesis, I opted for locating a different larger set.  Wanting to find a network with similar culture and behaviors to control where possible for other variables, I analyzed the House Resolutions from the same period.

House Observed
House Observed

Running the same test across the House Resolutions (1,986 resolutions vs 784 in the Senate), the shape was still not best fit to a power-law.  Instead, a logarithmic fit was near perfect (>0.99 R-sq).  So, while his does not prove my hypothesis, the shape of a log fit is similar to, but less dramatic than, power-law. This result certainly suggests further exploration.

One possible logical conclusion is distribution forms change with scale.  Much of the research on social networks  has been on large scale networks, where the math is at its most difficult.  At this smaller end of spectrum, especially with the Senate, the networks may be small enough that other analyses could be simpler.

Anthropologist Robin Dunbar, has done research showing humans can keep the interrelations of about 150 people in their heads.  More than that number, and we are out of luck.  With this in mind, it would make sense that relationship/contact distribution would stretch and distort as the number increases in scale.

So, if you are looking for the key members of a network smaller than “Dunbar’s Number,” there is an easier way to find out who they are: ask.  If you can get a few people who are already invested in the network to answer you truthfully, they will be able to give you a really good idea who the key people are.

Social Networks of the Senate

Co-sponsorship in the Senate (110th session)

I always enjoy analyzing social networks (SN’s) that have had a lot less press than the Goliaths of MySpace and Facebook.  I have done an awful lot of them, but one of my favorites was looking at the co-sponsorship patterns in the US Senate, 110th session (the current one).

This analysis was especially enjoyable because the graph is just one giant cluster, so conclusions took some real digging.  So, what did we learn?

We learned a few things: graphs are just the beginning of analysis (but we knew that already); not all junior Senators are as strategic as others; and directionality of the relationships can have a large impact.

There are a handful of junior Senators setting themselves up for favor by strategically co-sponsoring specific bills.  However, most junior Senators are building reputation by supporting anything that makes it to the floor.  I am going to have to go back and analyze previous sessions to see which approach seems to provide the better payoff.

Relationships by-and-large are unequal between participants.  Sometimes they are very close, sometimes they are very different. In our analysis of the Senate, many of these relationships are very unequal; a junior Senator is much more likely to co-sponsor a bill of a senior Senator than vice versa.  Without bringing this inequality into play, our notion of network centrality is challenged.  In this case, the two Senators most central include one first elected in 2004, followed closely by one who is a member of the powerful Senate Appropriations Committee.  If we view networks as expressions of influence over flow of information, including favors, that just doesn’t make sense.

When we start to bring directionality into consideration, which I did by splitting out the sponsors and co-sponsors for half of the Senate’s 104th session (1995); results become much more as expected.  The most central Senator was John Warner, then president pro tem.

Your network: for or against you?

Email Network (detail)

Your network can help you or work against you, it all depends on the level alignment between your network and your goals.  If you are trying to get something done with a team, your network should reflect that.  If you are looking for new opportunties, your network should reflect that.

I wrote a short piece for Pollock|Spark about personal networks and suggesting people beginning thinking about the power of networking to help meet their goals.

Every book on sales, finding a new job, etc. stress the importance of networking, and rightly so.  While is certainly easier for some than others, the validity to networking is no longer the question.  The question you want to ask yourself is: who?

Over our lifetimes of participating with networks ranging from work, to family, to neighborhoods, to hobbies; we accumulate many contacts.  There are significantly more effective and efficient ways to spread the word than reaching out to everyone you know, if you know your network.

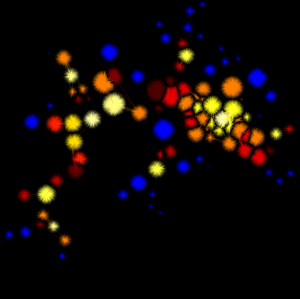
Let’s go through a few hints, using the image in this article created from my personal email over the past year or so.  Click on the image to blow if up larger.

  • Respect your friends and colleagues. If you abuse their hospitality and trust, not only will you lose them, but you’re also done for.
  • Don’t spend equal time with everyone.  Some people can help you more than others.
  • If everyone in a group knows each other, only spend time on only a handful of people. When everyone knows each other, the network is dense.  Many of the orange and yellow clusters in the image are dense.
  • Make a special effort with people that connect one or more of your groups.