City Green as a Function of City Parks

Naturehoods Explorer :: Stanford University
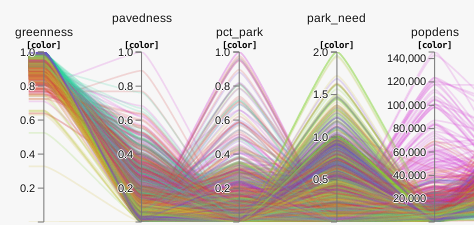
I stumbled across the City Nature project at Stanford via some interesting interactive data visualization they have created like the comparison between natural and social variables and the Naturehoods Explorer for 34 US cities.

One of the comments in the comparison chart (first project link), was lack of clear relationships between any of the provided variables. As I’m a glutton for punishment, I thought I’d give it a go.

With the addition of only two variables at the City level to the data provided by the Naturehoods Explorer, I was able to get a good start on a linear regression model. The two variables added are city population and number of parks in the city.

Below are results to linear regression models through R.

> summary(lm(park_count ~ . , data =g2))

Call:
lm(formula = park_count ~ ., data = g2)

Residuals:
    Min      1Q  Median      3Q     Max 
-267.25  -42.72   -2.30   56.81  189.01 

Coefficients:
              Estimate Std. Error t value Pr(>|t|)    
(Intercept)  5.636e+01  4.260e+01   1.323 0.185897    
greenness    4.061e+02  3.640e+01  11.157  < 2e-16 ***
pavedness   -1.881e+01  1.861e+01  -1.011 0.312164    
pct_park    -7.069e+01  1.416e+01  -4.994 6.30e-07 ***
park_need   -7.382e+00  4.833e+00  -1.528 0.126742    
popdens      4.525e-04  1.780e-04   2.542 0.011090 *  
h_inc        5.544e-04  1.293e-04   4.288 1.87e-05 ***
home_val    -2.578e-04  2.129e-05 -12.110  < 2e-16 ***
pct_own      4.294e+01  1.184e+01   3.627 0.000292 ***
diversity    5.461e-01  9.816e-02   5.563 2.91e-08 ***
nonwhite    -8.912e+01  7.936e+00 -11.230  < 2e-16 ***
parkspeak   -2.449e+02  3.087e+01  -7.933 3.12e-15 ***
lng         -6.429e-02  1.508e-01  -0.426 0.669870    
lat         -7.898e+00  3.937e-01 -20.060  < 2e-16 ***
population   1.649e-05  1.372e-06  12.023  < 2e-16 ***
---
Signif. codes:  0 ‘***’ 0.001 ‘**’ 0.01 ‘*’ 0.05 ‘.’ 0.1 ‘ ’ 1 

Residual standard error: 77.24 on 2646 degrees of freedom
Multiple R-squared: 0.447,	Adjusted R-squared: 0.4441 
F-statistic: 152.8 on 14 and 2646 DF,  p-value: < 2.2e-16

I also normalized the fields, except park_count, to get a feel of the relative impact of the individual variables across their very different scales.  The estimate indicates a change by one standard deviation of the variable.

> summary(lm(park_count ~ . , data =g3))

Call:
lm(formula = park_count ~ ., data = g3)

Residuals:
    Min      1Q  Median      3Q     Max 
-267.25  -42.72   -2.30   56.81  189.01 

Coefficients:
            Estimate Std. Error t value Pr(>|t|)    
(Intercept) 152.7865     1.4973 102.043  < 2e-16 ***
greenness    21.2528     1.9048  11.157  < 2e-16 ***
pavedness    -2.1510     2.1278  -1.011 0.312164    
pct_park     -8.3974     1.6815  -4.994 6.30e-07 ***
park_need    -2.8265     1.8503  -1.528 0.126742    
popdens       6.0435     2.3778   2.542 0.011090 *  
h_inc        15.4520     3.6039   4.288 1.87e-05 ***
home_val    -43.8665     3.6222 -12.110  < 2e-16 ***
pct_own       8.2300     2.2691   3.627 0.000292 ***
diversity    11.1726     2.0082   5.563 2.91e-08 ***
nonwhite    -21.6853     1.9311 -11.230  < 2e-16 ***
parkspeak   -14.3325     1.8066  -7.933 3.12e-15 ***
lng          -0.9985     2.3418  -0.426 0.669870    
lat         -40.1728     2.0026 -20.060  < 2e-16 ***
population   28.5058     2.3710  12.023  < 2e-16 ***
---
Signif. codes:  0 ‘***’ 0.001 ‘**’ 0.01 ‘*’ 0.05 ‘.’ 0.1 ‘ ’ 1 

Residual standard error: 77.24 on 2646 degrees of freedom
Multiple R-squared: 0.447,	Adjusted R-squared: 0.4441 
F-statistic: 152.8 on 14 and 2646 DF,  p-value: < 2.2e-16

For explanations of the data, collection method, etc., please see the City Nature Project.

Data updated with new city vaules in csv format

Load Volatility and Resource Planning for your Cloud

Having your own cloud does not mean you are out of the resource planning business, but it does make the job a lot easier. If you collect the right data, with the application of some well understood statistical practices, you can break the work down into two different tasks: supporting workload volatility and resource planning.

If the usage of our applications was changing in a predictable fashion, resource planning would be easy.  But that’s not always the case, and volatility can make it very difficult to tell what is a short term change and what is part of a long term trend.  Here are some steps to help you prioritize systems for consolidation, get ahead of future capacity problems, and understand long term trends to assist in purchasing behaviors. Our example is with data extracted from Red Hat’s ManageIQ cloud management software.

Usually, we collect and see our performance over X periods of time, where X is a small number and we don’t get much insight. More data points are help, but require a lot of storage. ManageIQ natively provides data rollup of metrics, to provide a great balance between the two.  Since we want to compare short term to long term for trends, we lose little using the rollup data.

shorttermOur graphs look at the CPU utilization history of four systems. The first graph looks only at the short term data, smoothed (using a process similar to the one described here) over one minute intervals. We smooth the data to reduce the impact of intra-period volatility on our predictions. The method described corrects for “seasonality” within the periods, e.g. CPU utilization on Mondays could be predictably higher than on Tuesdays as customers come back to work and get things done they could not over the weekend. The blue dot is the highest utilization, and red, the lowest over the period. Continue reading “Load Volatility and Resource Planning for your Cloud”

Measuring Load in the Cloud: Correcting for Seasonality

youngkra2Usage is over threshold, unleash the kraken! 

Short run peaks are perfect for automated elasticity: the unpredictable consumption that we stay up late worrying about fulfilling.  But, short run peaks can be difficult to tease out from expected variation within the period: seasonality.  Using the open source statistical package R, we can separate and look at both.

Continue reading “Measuring Load in the Cloud: Correcting for Seasonality”

Communication Method, Scale, and Entropy

In a surprise to Marshall McLuhan, we see ad hoc conversations conducted through different electronic media demonstrating very similar scaling characteristics across number of nodes, number of edges, and number of unique edges.  Looking at email lists, IRC, and long-term twitter searches, we more similarity than difference between the three media.

However, when look at the observed conditional entropy (below the fold), the differences become clear: communication patterns are very different by media type, even as the networks scale similarly in communicants.  Maybe McLuhan was right.

nodes vs unique edges

nodes vs total edges

unique vs total edges


Continue reading “Communication Method, Scale, and Entropy”

Replacing Google Reader in 10 Minutes

RIP Google Reader.

Even though all evidence pointed to it, I hoped it wasn’t going to happen.

Here’s my coping mechanism: OpenShift + Tiny Tiny RSS

I installed the Tiny Tiny RSS aggregator and reader using an +OpenShift  quickstart +Gunnar Hellekson put together.  If you already have an account, you can have your Google Reader replacement up in running in 10 minutes.

Step 1: Quickstart: https://github.com/ghelleks/Tiny-Tiny-RSS-quickstart

Step 2: Export everything from Google Reader https://www.google.com/takeout/#custom:reader

Step 3: Upload the subscriptions.xml file (found in the exported archive from Step 2). If you’re only reading through the web. You’re done.

If you want to read on your Android devices, two more easy steps.

Step 4: “Enable external API” under general preferences on your newly installed Tiny Tiny RSS server so you can access the contents through apps.

Step 5: Download a reader for your Android devices.  I chose TTRSS-Reader. https://play.google.com/store/apps/details?id=org.ttrssreader

Thanks to Gunnar for the OpenShift port, and Simo Sorce for turning me on to Tiny Tiny RSS.

I’ll miss you Google Reader.

Internet of Things and Twine

I’ve been asked by a number of people what is this “Internet of Things?” So, here’s a draft. Where do you disagree?

What if everything could share information?

Internet of things is making sharing information simple by bringing the network capabilities of computers to anything and everything.

Who knows what will happen in uses? Maybe it’s essential that Netflix pauses when the dryer finishes it’s cycle so you know to fold laundry before it wrinkles. But, big opportunities in “quantified self, ” home automation, retail supply chain (hey, I’m expired!), medical treatment, etc.

Basically, if intercommunication is so cheap that you can collect information from everything and take action on anything, what could you do with it?

Many technical revolutions fall into two categories: look what we can do that could never be done before, and look now it’s so cheap that everything can use it. (it’s really a continuum, but that’s “crossing the chasm,” etc).

Twine is smart because they make it simple to add basic functionality in this direction to existing stuff, so lowers the barriers to get started. Since it’s a new idea, we have no idea what all of the possibilities are, they make it simple for consumers to experiment.

Medication examples :

I want my pill bottle to tell my phone to have an alarm to remind me to take the drugs when my phone recognizes I’ve walked into the cafeteria.

I want my pill bottle to keep track of how many pills I have left. I want my phone to track this and remind me to refill early because it has my calendar and sees I have a trip coming up.

I always put stuff down, and can’t find it. I want my phone to ask my home alarm system where my pill bottle is.

I remember taking a pill, but can’t remember if that was today or yesterday. My pill bottle knows.

Drugs expire, send an email.

Drugs see what other drugs are in your medicine cabinet, that are yours (not the spouses) and checks for interactions you forgot to tell your pharmacist about.

Drugs reaching limits of storage temp (power failure?), send a notification.

How do you turn your phone into a tool?

I picked up a Galaxy S III over the summer, and a few minutes every week making the phone do more work for me.  What are your Android tips?

  • Change application view to alphabetical list or grid
    • Apps – menu – view type – select
  • Make sure you set up a password on your phone.
  • Put contact info on your lock screen
  • Create one touch icons for most common calls. I have one that I hit and it calls my wife’s personal phone. You can find it under widgets.
  • Alternatively, you can use the ‘favorites’ list, and have that as a widget on one of your pages.
  • Change the keyboard: Purchase SwiftKey from Google Play
  • Arrange icons so that most used are on the bottom row that stays with every page.
    • Mine are: phone, contacts, Google search, apps, and a folder containing work mail, Gmail, and texts.
  • Put regularly used apps, or apps you need in a hurry, on the front page.
    • Mine include a lot of reading, but also TripIt, RSA token, maps, remember the milk (lists), camera, etc.
  • Epistle to edit and sync text files with my laptop (uses dropbox)
  • For Web stuff I want to read (news articles etc) on the go, I use instapaper (website) and sync with instafetch (app). So, I always have plenty to read on planes.
  • Find news with Zite or Flipboard apps.
  • Create a calendar widget so you can see the next few days without having to open the app
  • I have 2 Remember The Milk widgets: what I have to get done for the day, and what I am waiting on others to do.

Daring Fireball: Open and Shut

John Graber of Daring Fireball has a great (albeit occasionally snarky) post challenging the value of “open” for shareholder value in technology companies.

The key point he starts to discuss, and then backs away from, is the value of externalities contributing to create better products faster.

Tim Wu also hints at this in his piece in the Newyorker, which kicked off Graber’s conversation. I’d like to hear more from both on this.

With an increasing demand for technology solutions to increasingly complex and evolving business problems, there’s a lot of money for whomever solves them. Share the wealth, and I bet we’ll provide our customers value faster now, and as the problems continue to change.

Life in a Networked Age

John Robb, who brought us the term “open source warfare,” wallops the concerns of governance of our increasingly global network:

A global network is too large and complex for a bureaucracy to manage.  It would be too slow, expensive, and inefficient to be of value.  Further, even if one could be built, it would be impossible to apply market dyanmics [sic] (via democratic elections) to selecting the leaders of that bureaucracy.  The diversity in the views of the 7 billion of us on this planet are too vast.

http://globalguerrillas.typepad.com/globalguerrillas/2013/02/life-in-a-networked-age-.html