The Baby Measureur

R Code for Our Kid

Not to long ago, a tiny, screaming, pooping, extraordinarily amazing data manufacturing machine came into my life. Long accustom to taking subtle cues from my wife, his arrival was not a surprise; so I had plenty of time to prepare my optimal workflow for consuming baby data. Basically, I just installed Baby Connect apps on all of our devices.1

Baby Connect syncs feeding, diaper, health and all sorts of devices across multiple devices. So, when I change a diaper, I record it and can get credit for it. They also provide a number of graphs so you can see changes in the input/output of your bundle. I wanted something that would point me to changes. Fortunately, in a stroke of genius, they also allow you do download the data in CSV format from their website.2 So, with no sleep, a month of paternity leave3, and ready access to data, I started putting together some R code looking for patterns through cluster analysis.4

Feeding the Beast

For the month and half this kid has been living with us, the model based clustering identified five clusters of feedings, when measured across the datetime, time of day, and duration of feedings.

Feeding Duration
My kiddo was eating either long or short, for the first week and a half. For the next two weeks the variation in duration of feedings came down enough to be considered a single cluster. For the next two-and-a-half weeks, the variation decrease further. The difference in feeding duration for the first fortnight is particularly noticeable in the graph below.
Feeding Duration

You’ll note I’ve discussed four clusters. The fifth has a single entry (Aug 19th, just before 5am). I have no idea what that’s about.

Long and short of it: if my kid’s like yours, you will definitively see changes to eating patterns over the first weeks.

Making Diaper Changing Cool Again

Running the similar tests over the diaper data, I calculate three clusters, and again see them largely grouped chronologically.
Diaper Timing
In the first, my boy went any damn well time he pleased. In the second, for a week, there’s a noticeable dropoff in quantity of diapers. In the third, quantity picks up again, but we also see the introduction of a small kindness: fewer changes after 9pm. Yes, interested parties, my boy is thankfully starting to fall into sleep patterns as well as sleep more. But, what’s going on in that middle cluster? For that, I look at the reasons for diaper changes.
Diaper Changes by Type
This graph requires explanation (and simplification). Aside from boredom and performance art, there are two main reasons I change diapers. These two reason are often, but not always, concurrent. This graph looks at those two reasons, and tests whether they are concurrent: yes on top, no on the bottom. The Y-axis is otherwise irrelevant, and variation is in place only so the points are more readable by not all occurring in a boring line.

What we see here is my data producer had ~2/3 exclusive diapers in his first two weeks. Then mostly double diapers, for a week. And now, about an even split. Note the shift to longer feedings during the same week (second graph), this coincided with a growth spurt, not that I can tell except for looking at my calendar.

What’s Next

Please, jump in. Take a look at the code. Use the code. Provide ideas, patches, comments.

Git Hub: babyconnectR


  1. Thank you, Gunnar
  2. I’d prefer a way to download it all at once, but by month isn’t so bad. 
  3. Thank you, Red Hat
  4. Most of the measures didn’t show me much, but I’ve added them all to the github repo as it could be an artifact of the data. 

NYC Taxi GPS

Chris Whong got a hold of a lot of GPS data for NYC taxis, using the cleverest hack of all: He asked nicely.

Not sure what I want to do with this yet, but spend an evening putting the basics together, and drew this from a small subset of the taxi dropoff locations. I love how the slightly fuzzy data lines up with street locations, and looks like the skeletons of pressed leaves.

dropoff
(click for full size)

There’s also an impressive zoomable map with both pickup and dropoff data by @enf.

[ hat tip to: @j0el ]

13 Years of VC Connections in NYC

Anyone ever tell you that fundraising is a small world? Drawing the graph of connections between funders and NYC companies from 2001 through the present, we see a highly connected core with most outliers representing single deals. That level of connectedness is why reputation matters so very much.

(Also thrilled to see the NYC funding ecosystem grow over the years!)

nyc

[data from CrunchBase]


The Value in Cost Shifting of Cloud Computing

There are a lot of threads around asking, “Is cloud computing less expensive than on-premise?” The short answer is: it depends. Here’s a quick outline of the why the better question is which provides more value.

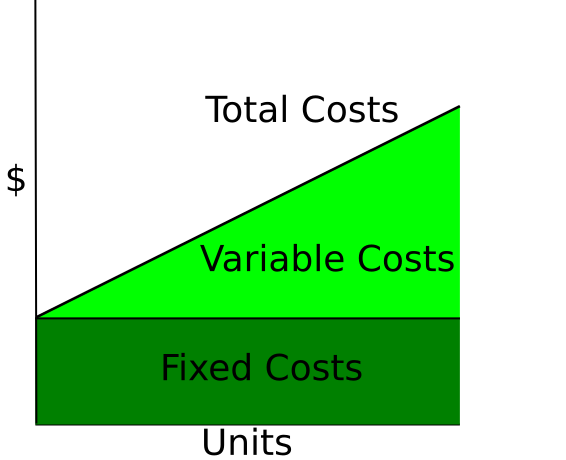
In economics, there are two types of costs in production: fixed costs and variable costs. Fixed costs are independent of the level of production. Buying a server is a fixed cost independent of the number of VMs run on that server. Variable costs are the per unit costs of production. The cost of applying operating system patches is a variable cost, it is dependent upon the number of VMs. Investing in fixed costs, servers supporting higher VM density, creates an economy of scale by reducing the variable cost of providing another OS instance to your customers. This is the production side of cloud economics.

On the consumption side, moving to cloud changes the fixed Capital Expense cost of hardware to a variable Operating Expense cost. Tying the cost of the infrastructure to the lifetime of the project reduces upfront costs.

Cloud Reduces Startup Costs
Reduction in Startup Costs

Spreading the costs over the life of the project does increase the terminal costs of the project, however this is not the problem it seems. With the cloud model, it is also simpler close down when the project is no longer providing the necessary value.

Terminal Costs in Cloud
Increase in Terminal Costs Ameliorated by Easier Shutdown

Combining the lower upfront costs and risk incurred of starting a new project by spreading the cost across the life of the project, it is easier and lower cost to begin more new projects. With the simplicity of exiting unprofitable projects, these new projects carry less organizational risk by lowering incurred legacy. More projects, at lower risk = more value creation, faster. Or, as we like to say in marketing: value creation through innovation.

If it’s amazing, but unusable, is it still a cloud?

In Boston this week planning for the new fiscal year, I stayed in a brand new boutique hotel. So brand new that the price was well below any of the local chains, and they hadn’t worked out all of their kinks.

The look and comforts of the room was excellent: clean design furniture, Lavazza in-room coffee, great shower, fireplace, big fluffy towels, the works. It was a beautiful room, and no expense was spared in making guests comfortable in this small but luxurious place. But, then I had to use the room.

Continue reading “If it’s amazing, but unusable, is it still a cloud?”