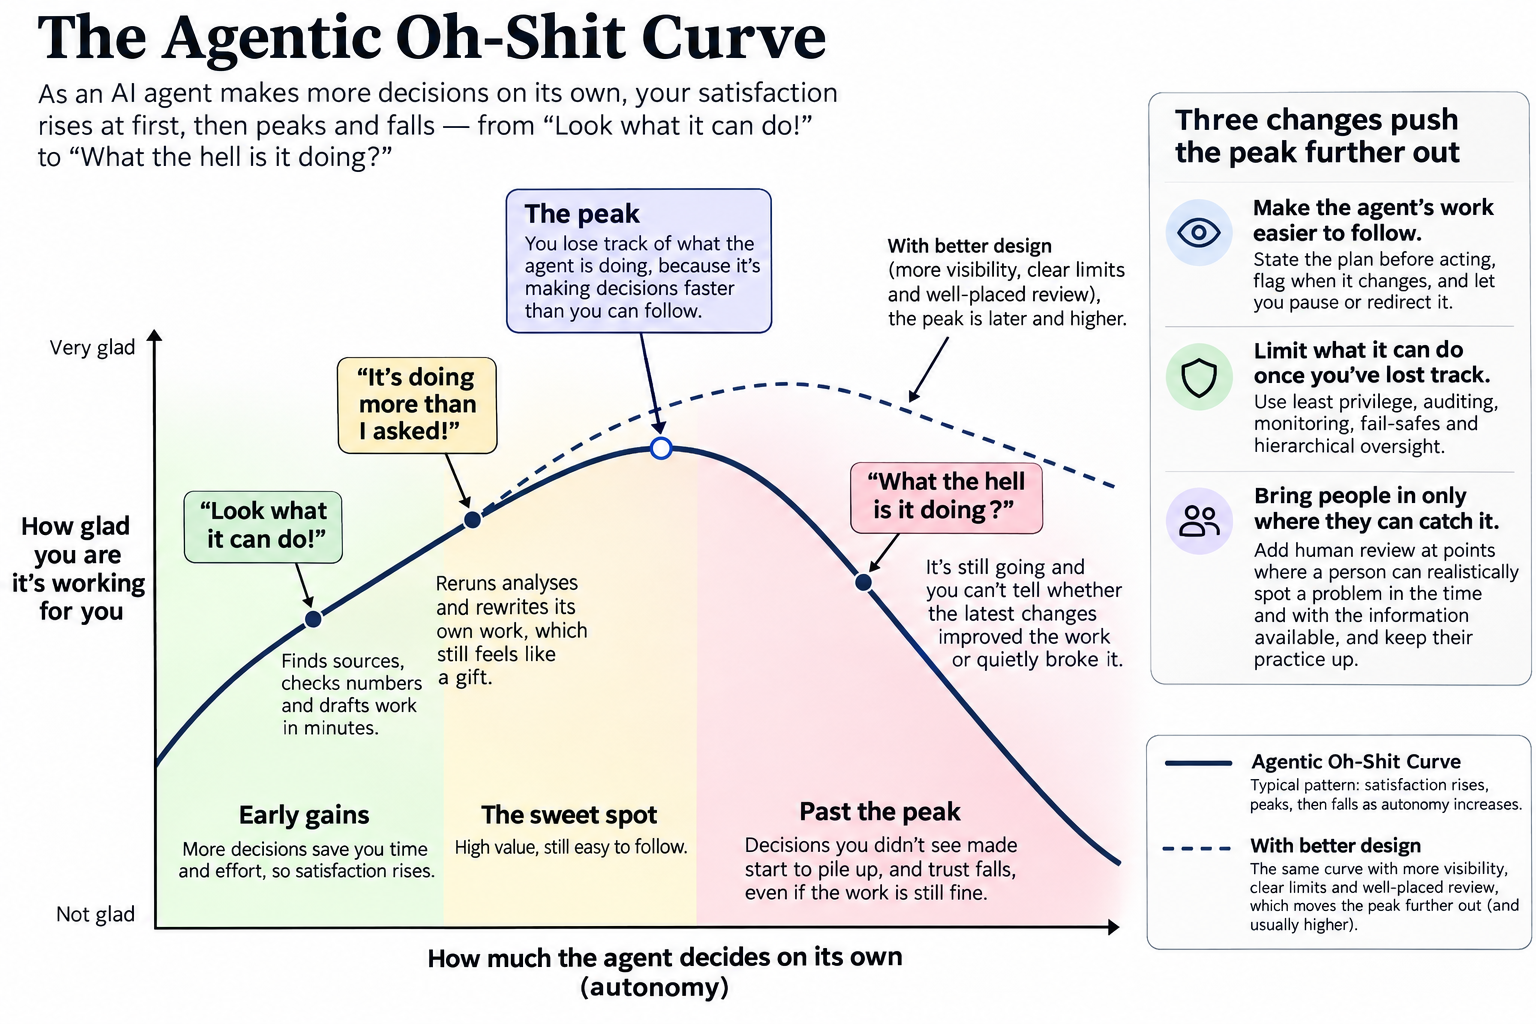
The most useful thing to decide about an AI agent is when it should come to you. Most agents today rarely do, so people find out how the work is going the only way they can, by watching it. That works for a while. Then the agent starts making decisions faster than you can follow, and you reach what I call the Agentic Oh-Shit Curve, where “Look what it can do!” turns into “What the hell is it doing?” even though the work itself may be fine.
Toyota and the airlines both worked through this problem, and both did it by reversing who calls whom. Toyota’s looms and assembly lines stop and signal when they need a person, and airliner cockpits display every autopilot mode change while crews call each one out. For agents, the same approach means the agent states its plan and says when it changes, its limits are enforced through permissions, people are brought in only where they can actually catch a problem, and the cost of supervision is in the budget.
How the curve works
Most people who have handed an agent a real task, such as turning a pile of data into a presentation, will recognize three reactions. The first is “Look what it can do!” as it finds sources, checks the numbers and drafts slides in minutes. The second is “It’s doing more than I asked!” as it reruns analyses and rewrites its own work, which still feels like a gift. The third is “What the hell is it doing?” when it’s still going and you can’t tell whether the latest changes improved the deck or quietly broke it.
The curve is a way of picturing that sequence. Put how much the agent decides on its own along the bottom and how glad you are that it’s working for you up the side. The line climbs at first, because each decision the agent takes off your hands is time you get back, and then it peaks. Past the peak, each additional decision makes you less glad, even when the work is as good as it was a minute earlier.
The peak is the point where you lose track of what the agent is doing, because it’s making decisions faster than you can follow them or not exposing them as it goes. Before it, you can see what the agent did and judge it. After it, decisions you didn’t see made start to pile up, and you begin to distrust output you would have accepted an hour earlier. The curve is a model rather than a measurement, but it turns a vague unease into two practical questions: where does the peak sit for this agent and these people, and what would move it further out?
Other industries found the peak first
Weaving mills met a version of this problem a century ago. An early power loom kept running after a thread broke and turned out flawed cloth until someone noticed, so mills kept workers busy doing little more than watching for breaks. Sakichi Toyoda’s looms, culminating in his Type G automatic loom of 1924, stopped themselves when a thread broke. Toyota later built that idea, called jidoka, into its production system, with machines that halt when something looks abnormal and andon cords that any worker can pull to stop the line.
Aviation met the problem when automated cockpits arrived. Earl Wiener spent three years in the 1980s studying airline crews flying the Boeing 757, one of the first airliners built around a computerized flight management system. The questions he kept hearing were what is it doing now, why is it doing that, and what will it do next, which is the third reaction on the curve in more polite language.
Nadine Sarter and David Woods spent the following decade working out where those questions came from, and the name that stuck was automation surprise: the system does something the crew didn’t expect and can’t readily explain. They found that the surprises rarely came from broken automation. The plane was usually doing what it had been set up to do, but the crew had lost track of which mode it was in or what target it was pursuing. Sarter and Woods traced the trouble to automation that had a lot of autonomy and authority to act while showing the crew very little of what it was doing.
The two industries describe the same curve from opposite ends. Autonomy is the distance along the bottom, and what the system shows you determines how far you get before the peak. The early cockpits were high on autonomy and low on visibility, which put crews past the peak, while Toyota’s machines announce their own problems, which is what let one worker tend several of them. Most agents today look like the early cockpits, so an agent that decides to rerun an analysis or pull in a new data source has switched modes, and usually nothing tells you it did.
The usual fixes leave the peak where it is
The most natural response is to wait for better models, but Lisanne Bainbridge explained in 1983 why more capable automation tends to make the human’s job harder. Automation takes over the routine work and leaves people the rare, difficult cases, so they get less practice just as the work left to them gets harder. Drawing on vigilance research, she also noted that people are poor at monitoring a system that almost never fails, and that their attention fades within about half an hour.
Applied to agents, the implication is uncomfortable. A more capable agent takes on more decisions, which moves you along the curve and past the peak sooner, and because it fails less often, you catch fewer of its failures and are less prepared when one arrives. Better models are worth having, but on their own they speed up the ride without changing its shape.
The second common response is to put a human in the loop at consequential decisions. As a hypothetical, picture an airline rebooking agent during a storm, reassigning four thousand stranded passengers and drafting compensation offers that a duty manager approves in batches of two hundred, with a few minutes for each batch. On paper she’s in control, but she’s far past the peak, approving decisions she can’t follow, and if the agent misread a fare rule, she signed off on it with no realistic way to have seen it. Madeleine Clare Elish calls this position a moral crumple zone, where the person in the loop absorbs the blame for a failure they had no real capacity to prevent and the system is protected at their expense.
The third response is to manage the agent like a capable employee, with a written mandate setting out what it may and may not do. Kropp and colleagues tested this framing in a large experiment reported in Harvard Business Review this year and found that treating agents like employees lowered individual accountability, increased unnecessary escalation and made human review worse. Written mandates also have a simpler weakness, because an instruction is something the agent might follow. If the agent shouldn’t change billing records, it shouldn’t have access to change them.
Three changes push the peak further out
Each of those responses can make an organization feel safer than it is, while the peak stays where it was. Toyota’s production system, the cockpit research and the security practices built up around software point to three changes that address the curve itself.
The first is making the agent’s work easier to follow. Woods and Sarter argued that automation had to become a better team player, and later work spelled out what that requires: operators can see what the system is doing and about to do, and can redirect it without a fight. For an agent, that means stating its plan before acting, flagging when the plan changes, and letting you pause or redirect it without starting over. Each decision you can follow stops pushing you toward the peak, which is what the dashed line in the sketch shows.
The second is limiting what the agent can do once you’ve lost track of it. Arvind Narayanan and Sayash Kapoor list controls that hold up whether or not the agent understood its instructions: least privilege, auditing, monitoring, fail-safes and hierarchical oversight. These are tools organizations already use to secure software, and while they won’t keep you before the peak, they cap what can happen after it.
The third is placing human review only where the reviewer can realistically catch a problem in the time available, with the information the system provides. Toyota’s andon cord works because the worker who pulls it can see the problem in front of them in time to act, and review steps for agents need the same property. Where that isn’t true, either redesign the step or state plainly that the organization is accepting the risk. Because the people you rely on for rare, hard cases lose practice as the agent improves, that practice also has to be built in deliberately.
The far side of the curve shows up in the budget
Supervision is the cost most business cases leave out. Writing the task, watching the agent, checking the output and fixing mistakes all come out of the time the agent saves, and that work grows once you’re past the peak and no longer trust what you can’t follow. As a simple illustration, an agent that saves eight hours of production work and creates six hours of review has saved two.
There is early evidence that these hours go uncounted. Baslandze and colleagues surveyed nearly 750 executives for a National Bureau of Economic Research (NBER) working paper this year and found that perceived productivity gains ran ahead of measured ones. Because the data is self-reported, it can’t explain the gap, and unpriced supervision is a plausible cause rather than an established one. Narayanan and Kapoor make a related point: as execution moves to software, the human work that remains is specification and oversight, and if nobody budgets for it, it lands on whoever was supposed to be freed up.
Expect to find the peak again
Each new generation of agents can decide more on its own, so the peak will keep moving and you’ll ride this curve more than once. The test for any agent you deploy is whether it comes to you when it should: whether it tells you its plan, stops at its limits, and brings you in at a point where you can still catch a problem. When it does, you can stop watching it, and the time it saves is real.
Toyota and the airlines both found the peak and spent decades learning how to move it. Organizations deploying agents can start from that record instead of rebuilding it through their own incidents.
Sources
Bainbridge, L. (1983). Ironies of automation. Automatica, 19(6), 775-779.
Wiener, E. L. (1989). Human factors of advanced technology (“glass cockpit”) transport aircraft. NASA Contractor Report 177528.
Sarter, N. B., & Woods, D. D. (1994). Decomposing automation: Autonomy, authority, observability and perceived animacy. In M. Mouloua & R. Parasuraman (Eds.), Human performance in automated systems: Current research and trends (pp. 22-27). Erlbaum.
Sarter, N. B., Woods, D. D., & Billings, C. E. (1997). Automation surprises. In G. Salvendy (Ed.), Handbook of human factors and ergonomics (2nd ed.). Wiley.
Woods, D. D., & Sarter, N. B. Learning from automation surprises and “going sour” accidents: Progress on human-centered automation.
Elish, M. C. (2019). Moral crumple zones: Cautionary tales in human-robot interaction. Engaging Science, Technology, and Society, 5, 40-60.
Kropp, M., Bedard, J., Wiles, E., Hsu, M., & Krayer, L. (2026, May). Research: Why you shouldn’t treat AI agents like employees. Harvard Business Review.
Narayanan, A., & Kapoor, S. (2025). AI as normal technology. Knight First Amendment Institute at Columbia University.
Baslandze, S., et al. (2026). Artificial intelligence, productivity, and the workforce: Evidence from corporate executives. NBER Working Paper No. 34984.
Ohno, T. (1988). Toyota production system: Beyond large-scale production. Productivity Press.
Japan Society of Mechanical Engineers. Non-stop shuttle change Toyoda automatic loom, Type G. Mechanical Engineering Heritage No. 16.